Visualization
Visualizations in the DEA can be build through any module that results in html-embeddable plots.
This could just be generated matplotlib file::myplot.png files, or it could be fancy interactive visualizations. The default implementation uses`bokeh`_ for beautiful and customizable plots like this:

(Image borrowed from the bokeh project site)
Adding Visualizations
There are two places where visualizations can be added to the DEA, to add visualizations on cohort level, reference the dea.app.overview() route, which passes the plot created in dea.app.plot_cohort_hist().

To add visualizations on the encounter level, reference the dea.app.route_encounter() route, which creates the plot inline and also shows the pygwalker integration.
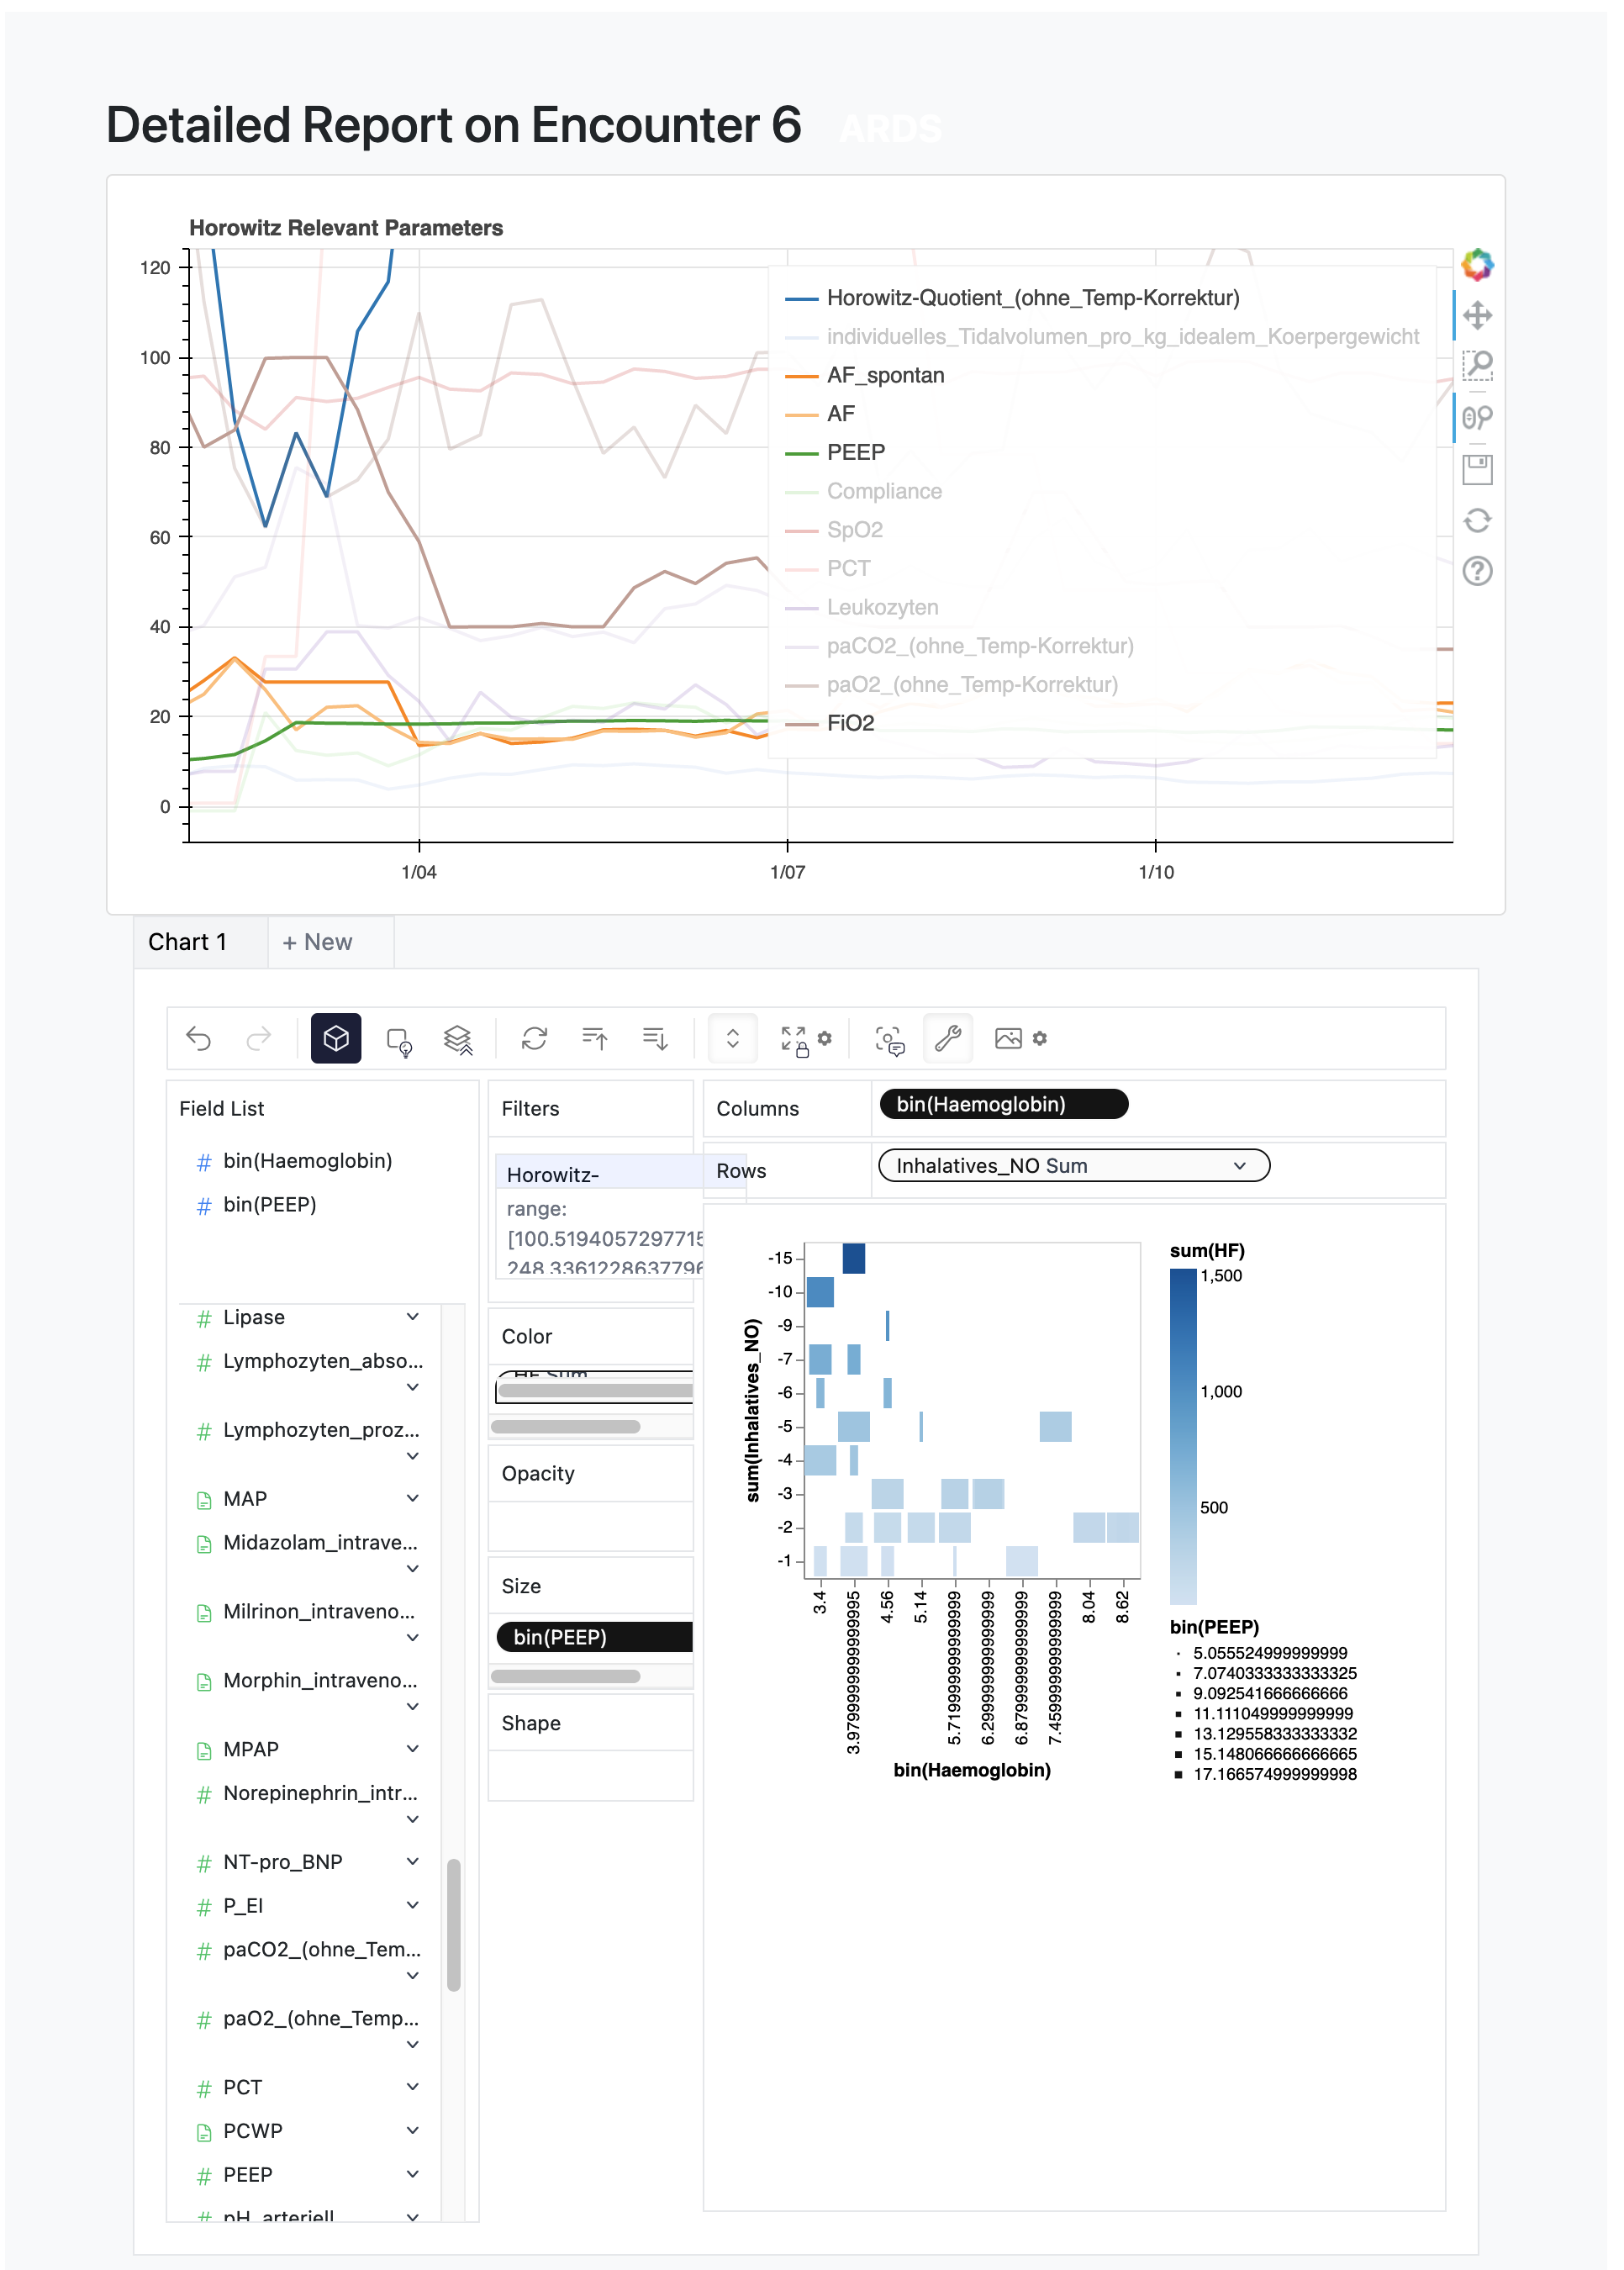
Bokeh Visualization example
X = df.index
features = df.columns
p = figure(
    title="Example Plot",
    sizing_mode="scale_width",
)
for y in features:
    p.line(
        X,
        e.loc[y],
        line_width=2,
        legend_label=y,
        color=Category20[len(features)][features.index(y)],
    )
p_html_str = file_html(p, CDN)
plots = [p_html_str]  # plots is a list of plots that will be displayed in the DEA