Diagnostic Expert Advisor


The Diagnostric Expert Advisor is a lightweight toolkit to enable medical researchers to quickly get started with their work.

This repository provides the tooling to rapidly launch into data exploration, model development and HPC processing. It is based on Flask, one of the most popular Python web application frameworks and works with all your favorite data science tools. By default the DEA provides
Intuitive Dataset Structuring,
Easy HPC Interfacing and
Customizable Visualization
While the DEA offers suggestions, it does not enforce the use of any specific structures, layouts or libraries and researchers can decide themselves which tools best fit the job.
Installing
Clone the repository and setup the environment:
$ git clone git@github.com:JRC-COMBINE/DEA.git
$ cd DEA
$ conda create --name dea --file requirements.txt
$ conda activate dea
Optionally download sample data:
$ cd tests
$ wget https://github.com/JRC-COMBINE/DEA/releases/download/v0.1.0-alpha/testdata.zip
$ unzip testdata.zip  # data is located in DEA/tests/data, feel free to explore the structure!
$ cd ..
$ python quickstart.py # generate a cohort from the test data into DEA/dea/data
Finally start the Flask server:
$ cd dea
$ flask run  # add --debug to update on code change.
Where do I start?
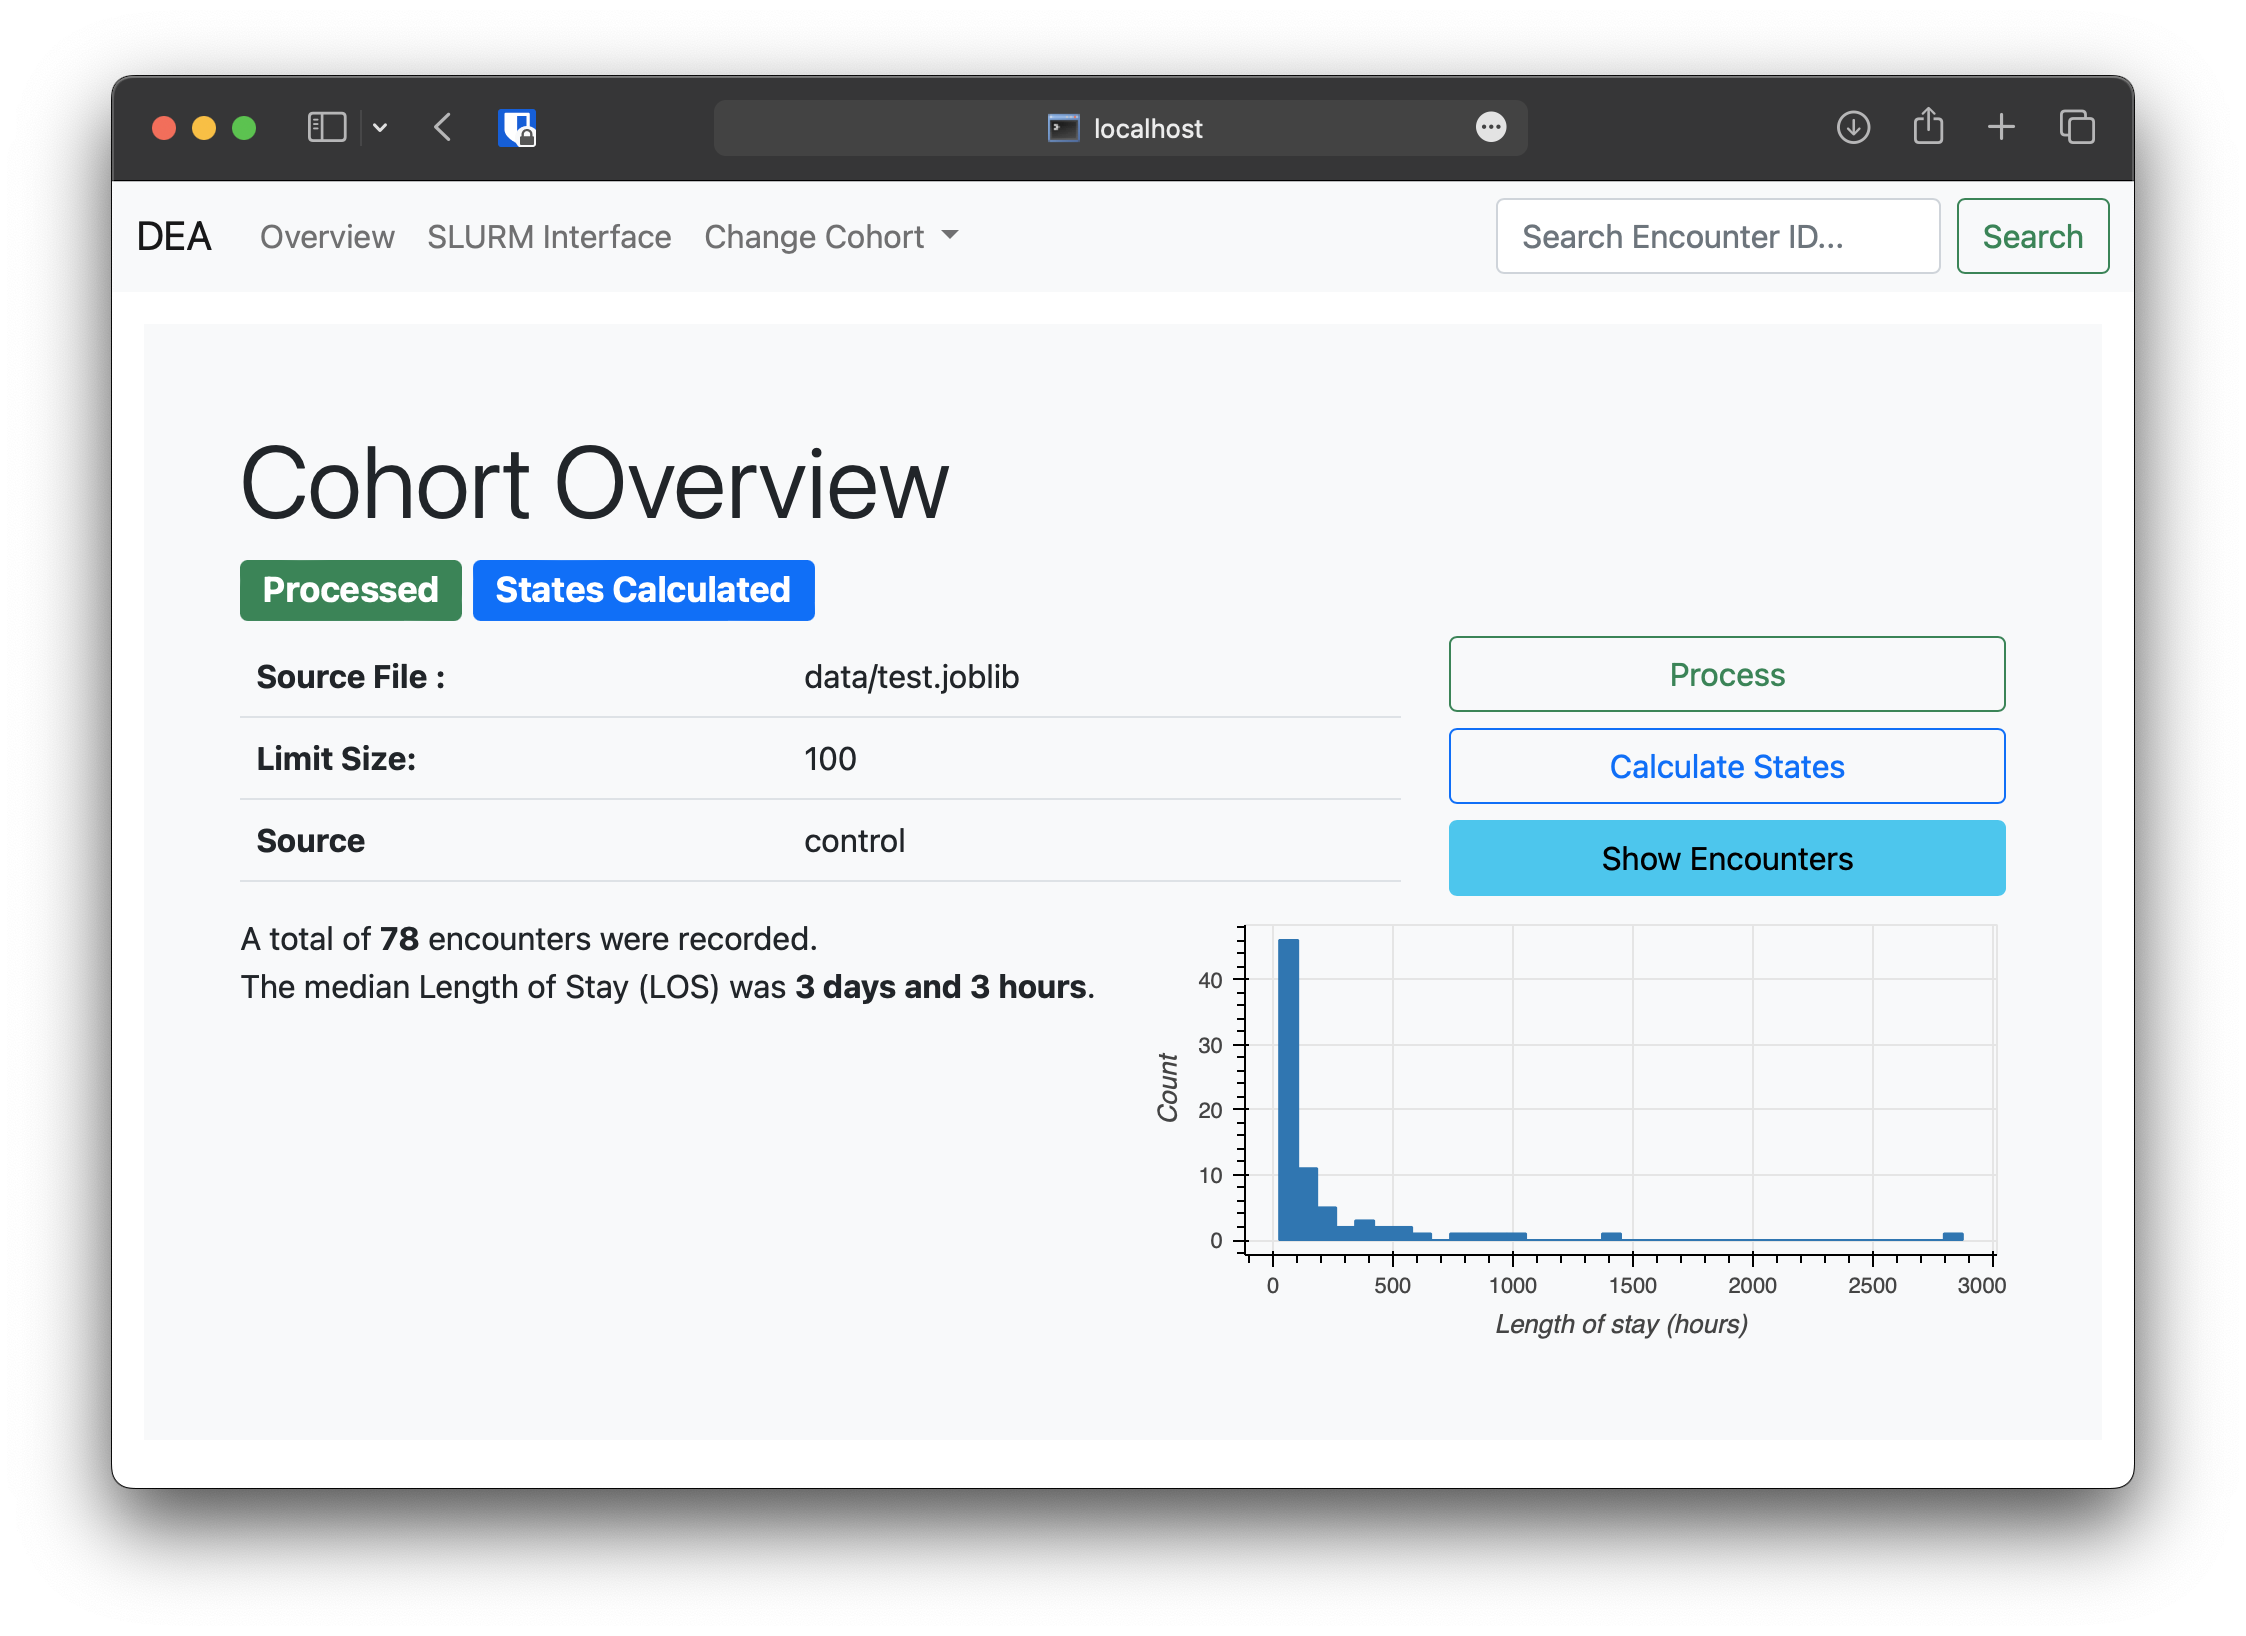
First of all you need to get your data into the DEA format. Luckily this is just a thin wrapper around Pandas DataFrames in the form of encounters and cohorts. You can think of cohorts as a list of encounters, with encounters being a single visit of a patient to the hospital. Such an encounter contains measurements over time (think heartrate) as well as static information (e.g. height) and some metadata. Once the data is in the correct format (or you adapted the DEA to your format), there is various ways to progress:
Explore individual Encounters using PyGWalker, through a “Tableau-style User Interface for visual analysis”
Create custom visualizations and automate analysis for the whole cohort or individual encounters ( Go here: Visualization )
Run computationally expensive calculations in parallel on High-Performance Computing Infrastructure ( t.b.d )
Use your usual workflow to develop ML models and deploy them to the DEA ( t.b.d. )
Create customized filters to verify and test model behavior on specific groups of interest ( Go here: Filters )
Contributing
If you want to contribute to the DEA, please reference our contribution guidelines
Links
Documentation: https://diagnostic-expert-advisor.readthedocs.io/en/latest/
Issue tracker: https://github.com/JRC-COMBINE/DEA/isssues
